1
2
3
4
5
6
7
8
9
10
11
12
13
14
15
16
17
18
19
20
21
22
23
24
25
26
27
28
29
30
31
32
33
34
35
36
37
38
39
40
41
42
43
44
45
46
47
| library(ggplot2)
library(animation)
library(dplyr)
library(tidyr)
library(xlsx)
library(ggthemes)
male<-read.xlsx("population simulation.xlsx",sheetName="male2",header=T,encoding='UTF-8',check.names = FALSE)
female<-read.xlsx("population simulation.xlsx",sheetName="female2",header=T,encoding='UTF-8',check.names = FALSE)
female<-female%>%gather(Year,Population,-1)
male<-male%>%gather(Year,Population,-1)
female$Population<-female$Population*-1
male$sex<-"male";female$sex<-"female"
maoming<-rbind(male,female)
maoming$Population <- round(maoming$Population)
maoming$abs_pop <- abs(maoming$Population)
maoming$agegroup<-factor(maoming$agegroup,
levels=c("0-4","5-9","10-14","15-19","20-24","25-29","30-34","35-39","40-44","45-49", "50-54","55-59","60-64","65-69","70-74","75-79","80-84",'85-90','91-94','95-99'),order=T)
m<-seq(2010,2035,by=1)
saveGIF({
for (i in m) {
title <- as.character(i)
year_data <- filter(maoming,Year==i)
g1<-ggplot(year_data,aes(x =agegroup,y=Population,fill=sex,width=1)) +
coord_fixed()+
coord_flip() +
geom_bar(data=subset(year_data,sex=="female"),stat = "identity") +
geom_bar(data=subset(year_data,sex=="male"), stat = "identity") +
scale_y_continuous(breaks = seq(-400000,400000,length=9),
labels = paste0(as.character(c(abs(seq(-40,40,length=9)))), "w"),
limits = c(-450000, 450000)) +
theme_economist(base_size = 14) +
scale_fill_manual(values = c('#D40225', '#374F8F')) +
labs(title=paste0("Population structure of Maoming:", title),
caption="Data Source: Census data of Maoming City, the 2010 Revision"
,y="Population",x="Age") +
guides(fill=guide_legend(reverse = TRUE))+
theme(
legend.position =c(0.8,0.9),
legend.title = element_blank(),
plot.title = element_text(size=20),
plot.caption = element_text(size=12,hjust=0),
)
print(g1)
}
},movie.name='maoming_population.gif',interval=0.5,ani.width=700,ani.height=600)
|
 Fig.1 Population Pyramid,2010-2035
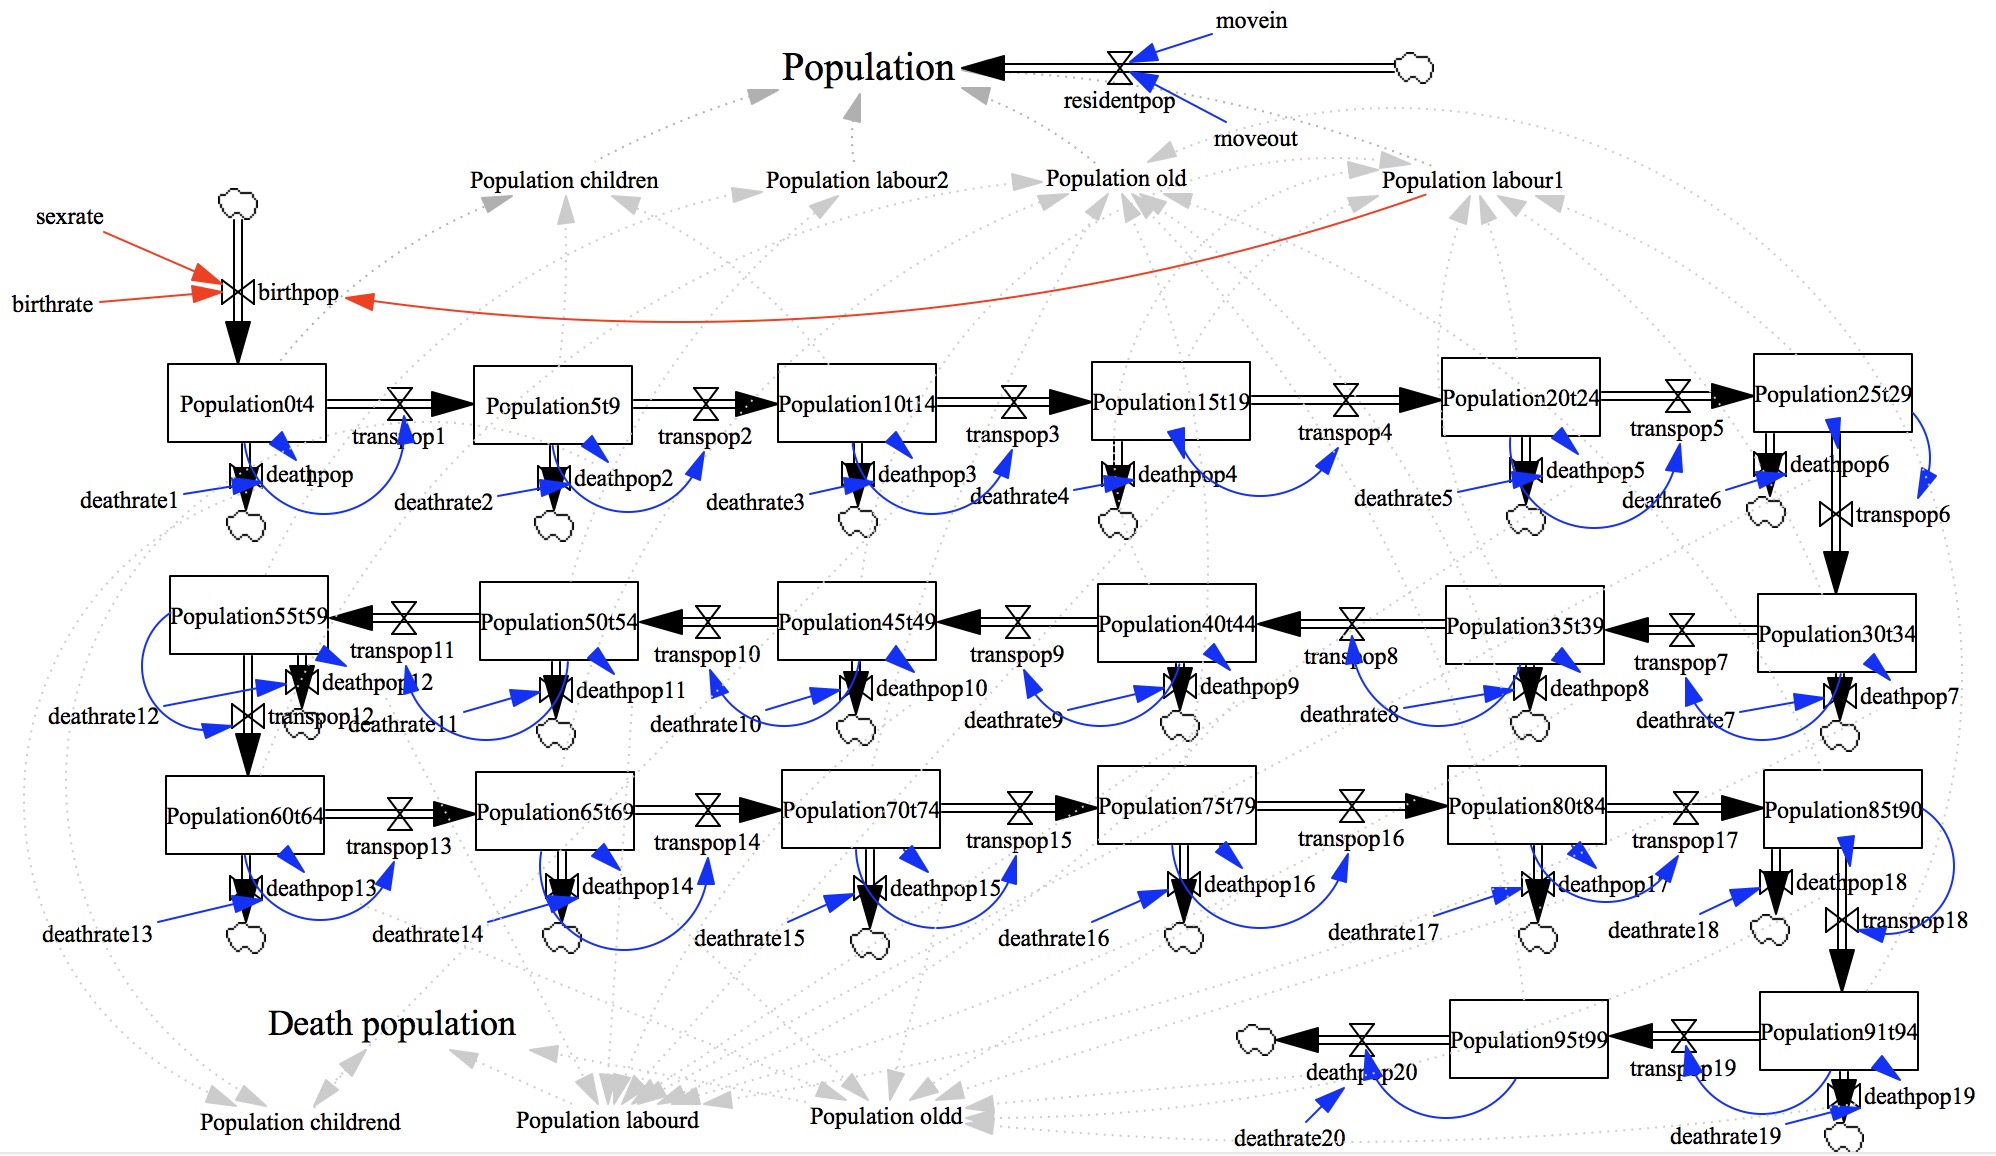 Fig.2 System Dynamics Graph